How is data gathered?
So how does digitalisation actually work? Let’s start off by looking at the data collection methods.
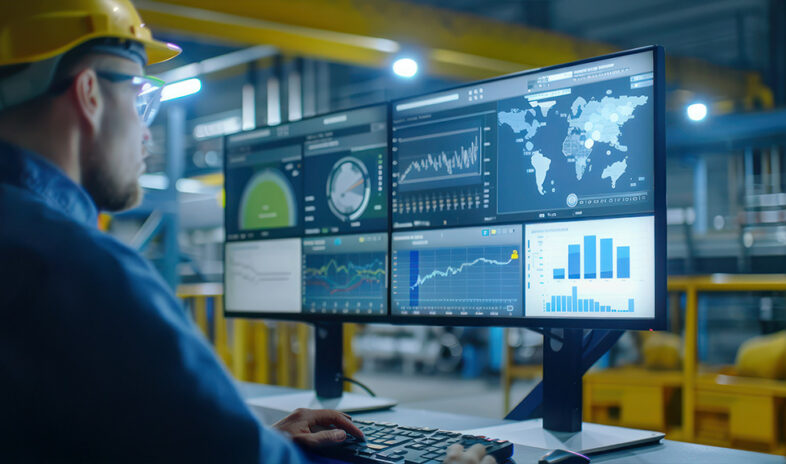
The sortation system that makes up the physical side of a distribution centre is equipped with various PLCs. These PLCs detect all kinds of information from the system: temperature, vibrations, power consumption, processing speed and much more. We call these raw data.
Another example: weighing units. An important component in almost every sortation system. One would think a scale just tells the weight, but inside the weighing units, you will find a processor that works as a small computer with the capacity and ability to process all kinds of information specifically related to the process of weighing. This is known as edge analytics.
Both streams of data, edge analytics and raw data, provide valuable insight into the sortation system performance but at different levels. The weighting unit, for example, will have processed the data locally and can tell exactly what’s wrong. The sensors, on the other hand, will leave the conclusion to be made by processing the data. That is data analytics.
Data tell us how every component of the sortation system operates and how the sortation system processes items. When analysing data, patterns begin to reveal themselves in terms of the two subjects: operations and equipment.
For example, the system might find that specific types of packaging often causes manual sortation. Or that a breakdown occurs every time the conveyor belt reaches a certain temperature. Or that a specific pattern of vibrations from the chutes reveal that the machines perform poorly. Instead of this information only being inside someone’s head, the distribution centre can collect and analyse the data to get more insights. The result is essentially a completely transparent distribution centre.
“The result is essentially a completely transparent distribution centre.”


